Python Dashboard using Dash. From Backend to Frontend
Building Web Application Dashboard Using Python (Dash)

The business intelligence dashboard is an important analytics tool that is used to visualize data across all industries. Using these dashboards, useful insights to Business Performance Management such as the critical reporting and metric information can be readily displayed and used by various departments to drive actionable business decisions.
To help drive and generate better business decisions, the analytics team in Mock Company had developed a web application using Python programming language with the help of the Dash module. Our application aimed to aid the sales department in providing historic sales and profitability performance, and visualization of various aspects such as geographical sales performance monitoring and sales against profit by product category.
This documentation highlights the prerequisites, data pipeline, and the demonstration of the use of the application.
1. Getting Started
The instructions below will help you set up the environment.
Prerequisites To use the program, ensure that Python v3 and the following libraries are installed on your operating system:
1. Dash
2. Plotly
3. Dash-bootstrap-components
4. sqlalchemy
5. Pandas
If you do not have the modules installed on your system, please follow the instruction below.
Installation on Windows using terminal:
py -m pip install dash
py -m pip install plotly
py -m pip install dash-bootstrap-components
py -m pip install sqlalchemy
py -m pip install pandas
Installation on Linux using terminal:
$ pip install dash
$ pip install plotly
$ pip install dash-bootstrap-components
$ pip install sqlalchemy
$ pip install pandas
2. Data Pipeline
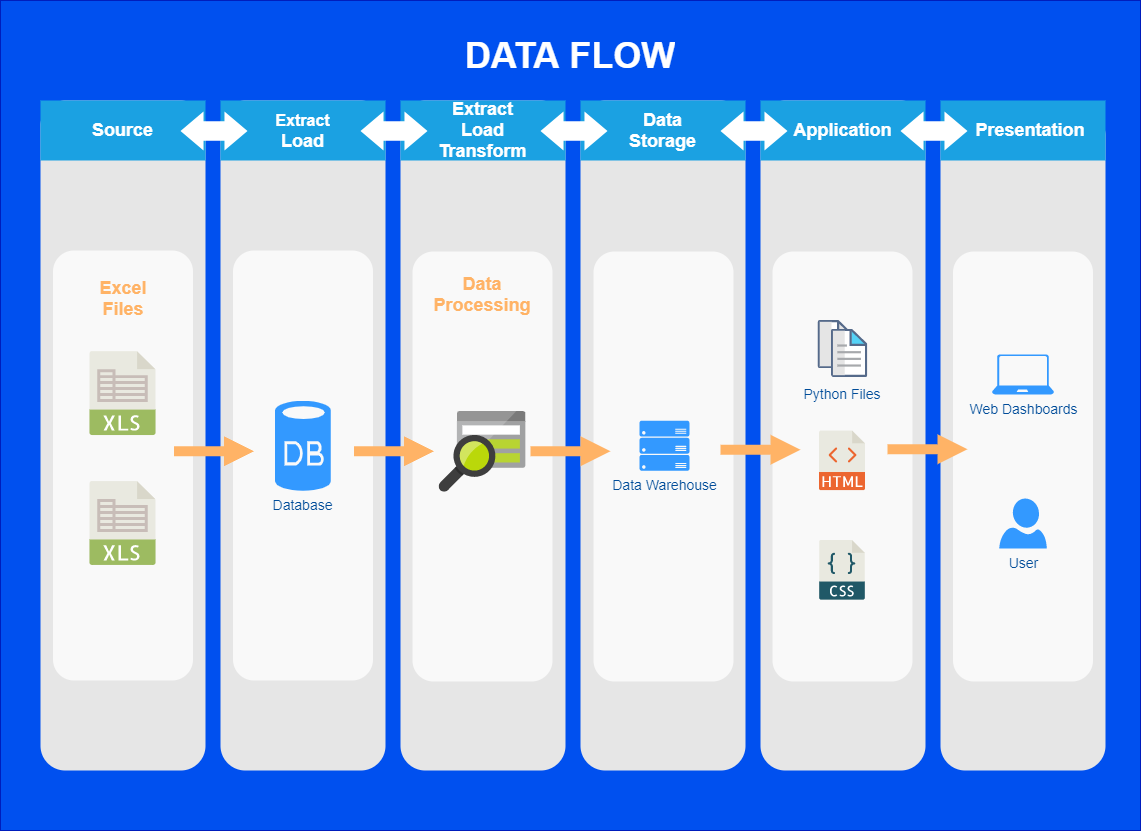
Below is an illustration of the data flow for our application.
Firstly, the data was extracted, loaded and normalized before insertion into a database via SQlite.
Next, we then query the data from the database, perform ELT techniques, denormalized the data and transfer the data to a data warehouse.
Lastly, we query the denormalized data from the data warehouse, run it through our application, and our application will visualize the data onto a web address.
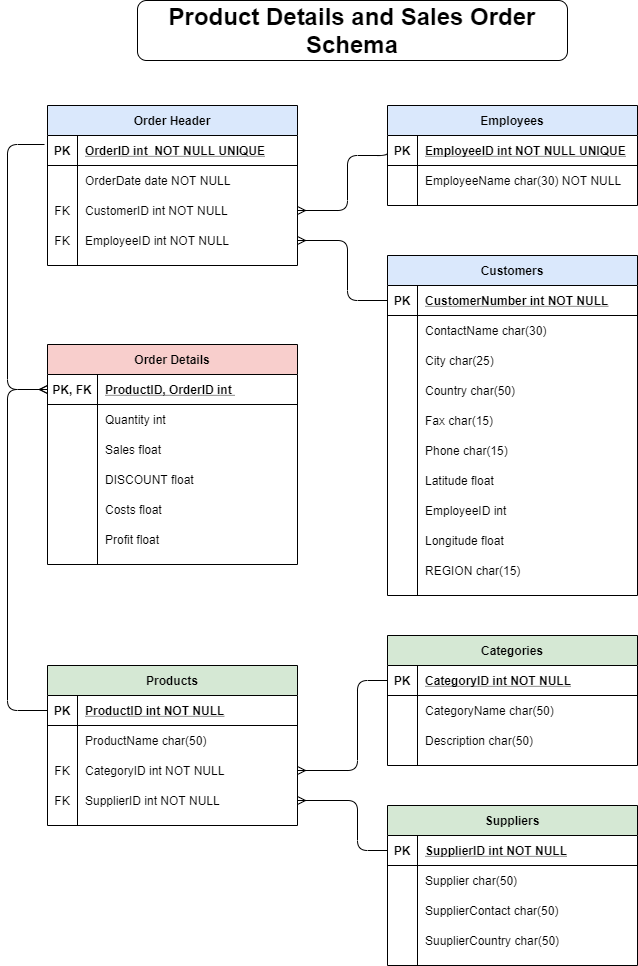
3. Normalized Database Schema
4. Folder Structure
The structure of the Dash application is presented below:
- app.py
- assets
    |-- index.css
    -images
        |-- logo.png
- datasets
    |-- DBmanager.py
    |-- elt.py
    |-- extract_load.py
    |-- initialize_datawh.py
    |-- peration_database.py
    |-- data_warehouse.db (Generated with DBmanager.py)
    |-- peration.db (Generated with DBmanager.py)
    -sources
        |-- Product Details.xls
        |-- Sales Orders.xls
5. Demonstration
The processes of running this application will be shown in this section.
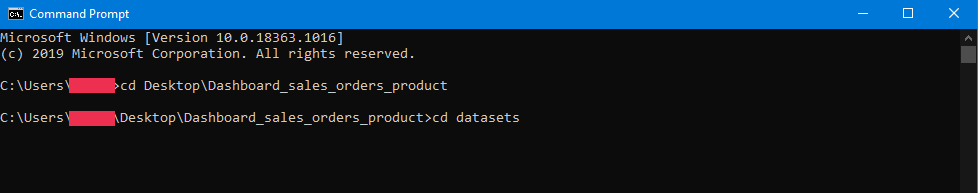
To run the program, firstly, we need to setup and populate both the database and data warehouse. This process will be performed using DBmanager.py and it can be performed as below.
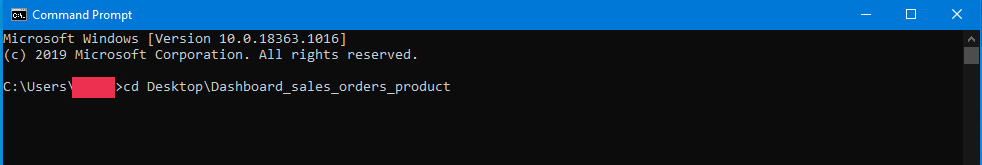
Type in cmd:
cd Desktop
cd Dashboard_sales_orders_product
DBmanager.py
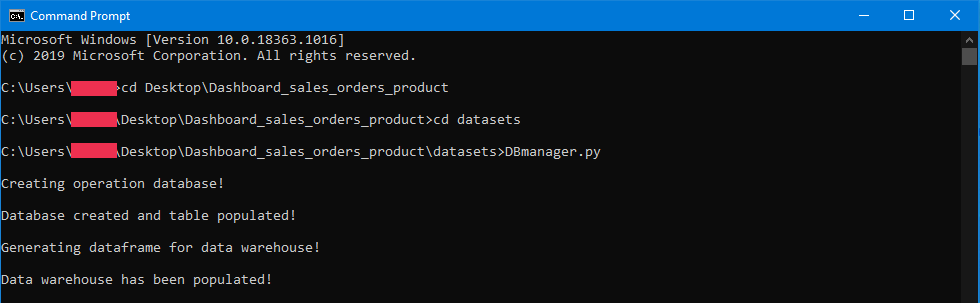
After the population of database and data warehouse, the next step is to run the Dash application using app.py file. The Dash application will start, and as we set the app.py to run in development mode, a development IP server will be generated.
Type in cmd:
app.py
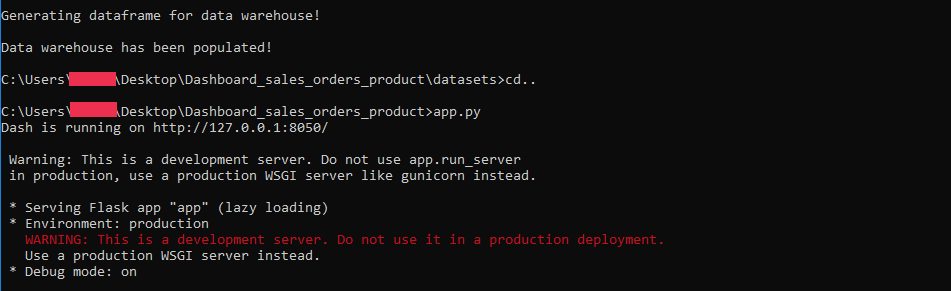
Copy ‘http://127.0.0.1:8050/’ and insert it into any browser to show our dashboard.
Capture.PNG
In total, there are 4 visualization and 6 KPI shown.
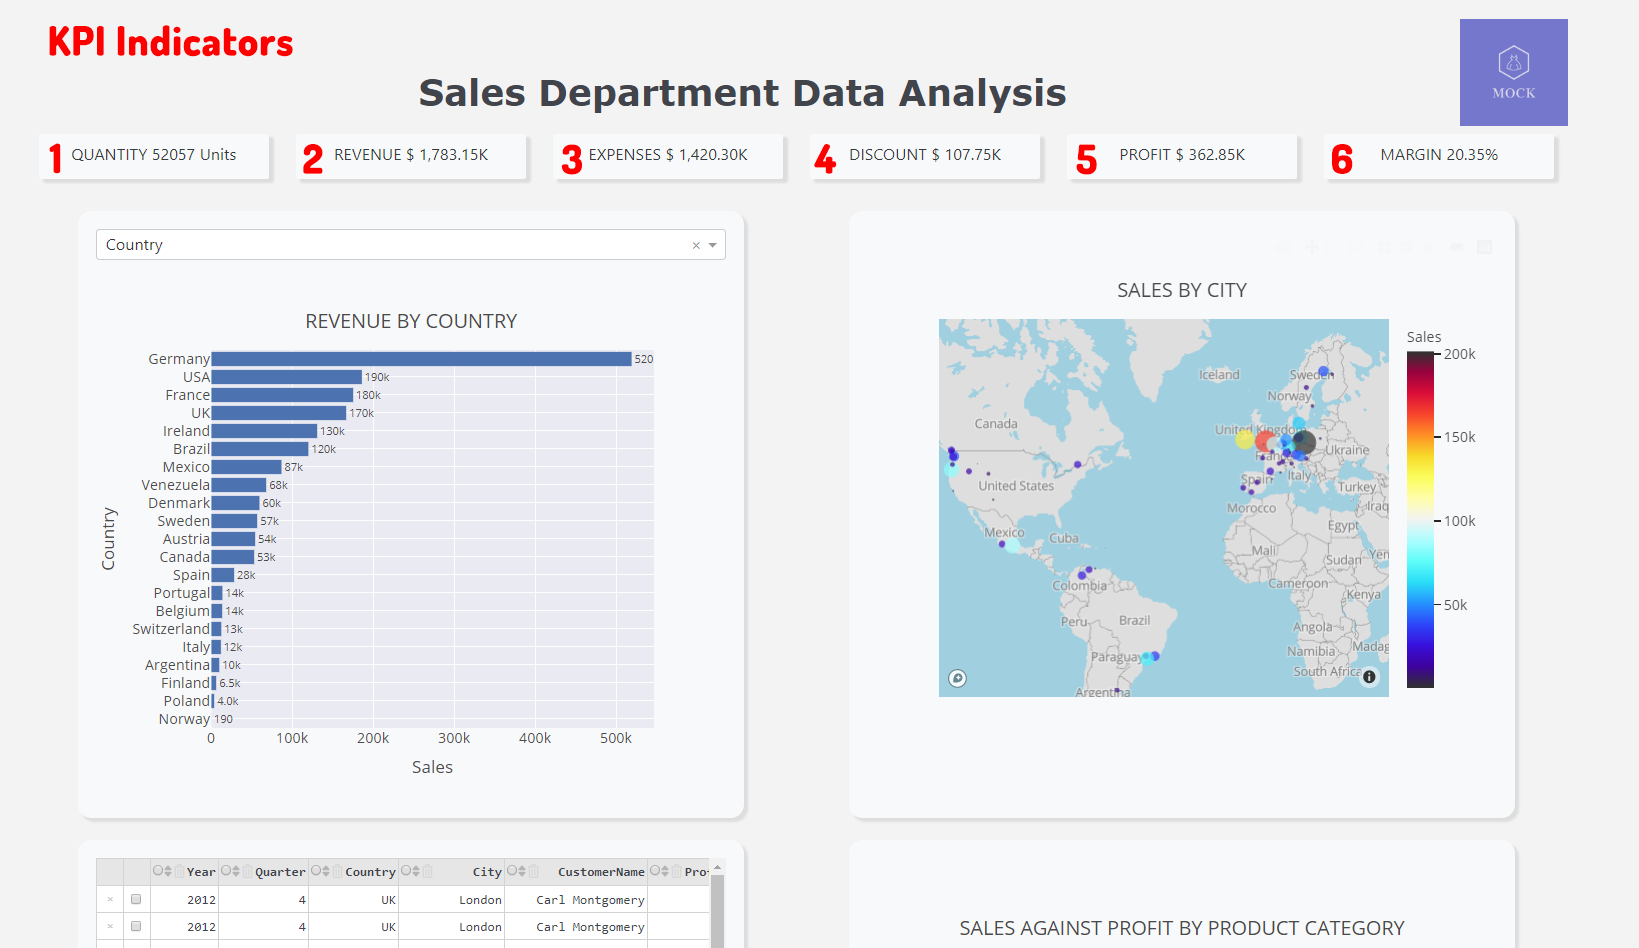
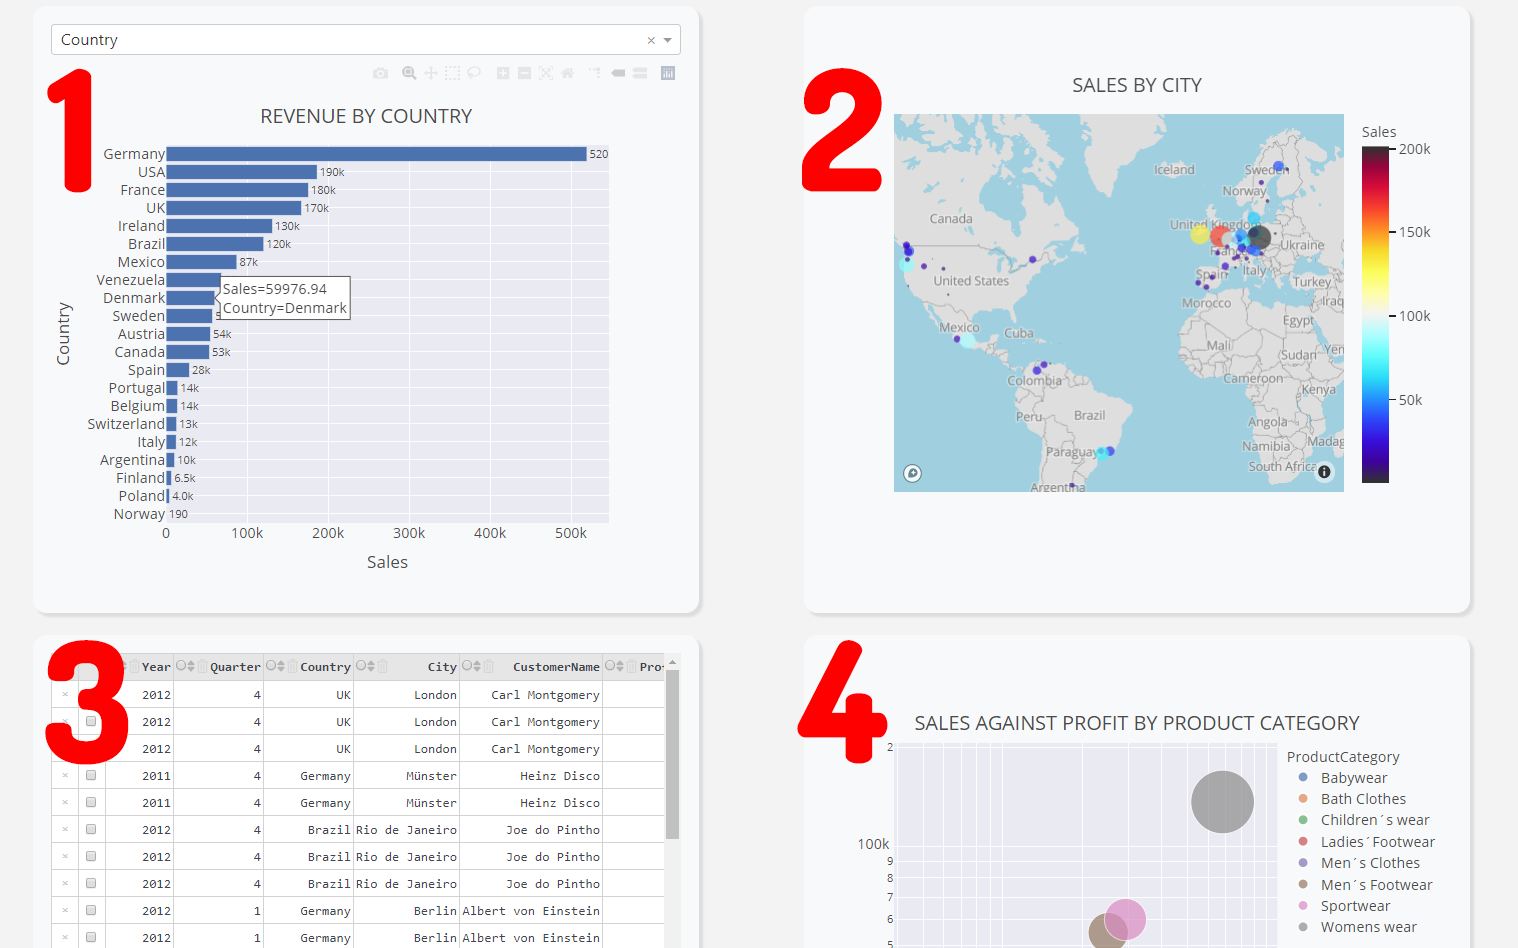
The data points on the data visualization can be hovered.
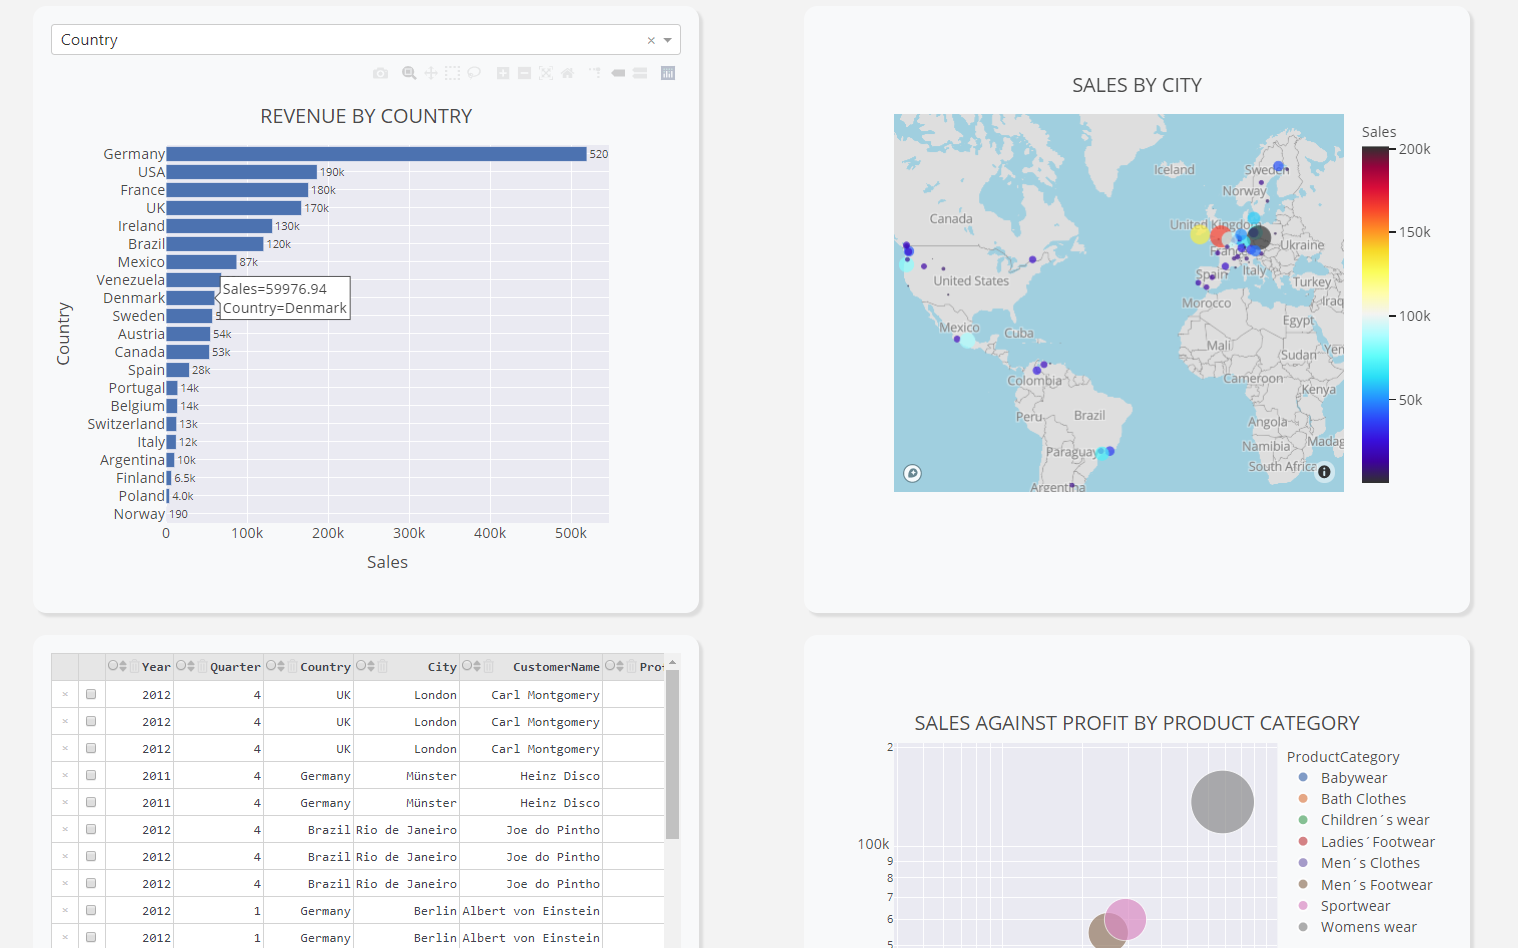
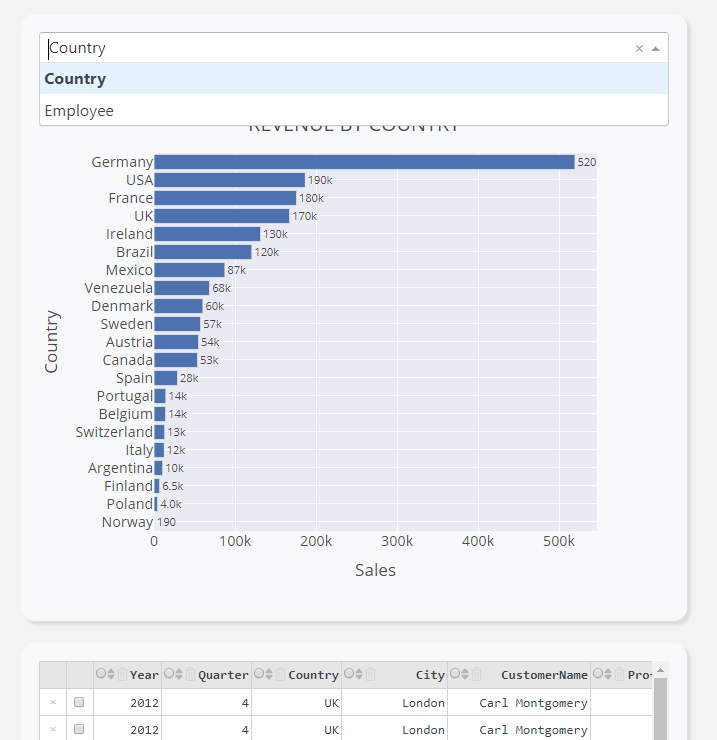
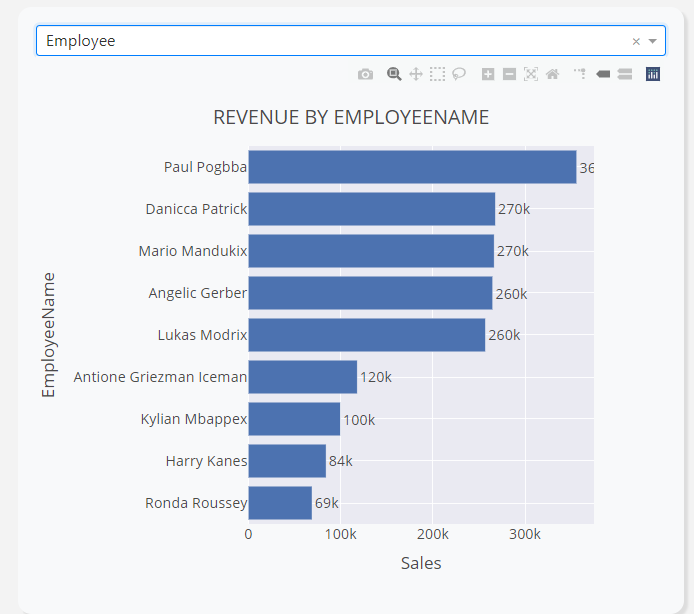
Using dash callback python declarators, the first data figure can be interacted with. I’ve made a drop down menu, which parses in the variable to the plotly graph, and the graph will be generating depending on the variable.
6. Future implementation
The future implementation of Conversational Analytics may be done using dash_core_components ‘input’ syntax.
https://dash.plotly.com/dash-core-components/input
Built With
- Dash - Create Dashboard Web application, interact with HTML and CSS syntax
- Sqlite3 - Simulate Data warehouse
- Plotly - Use to visualize data